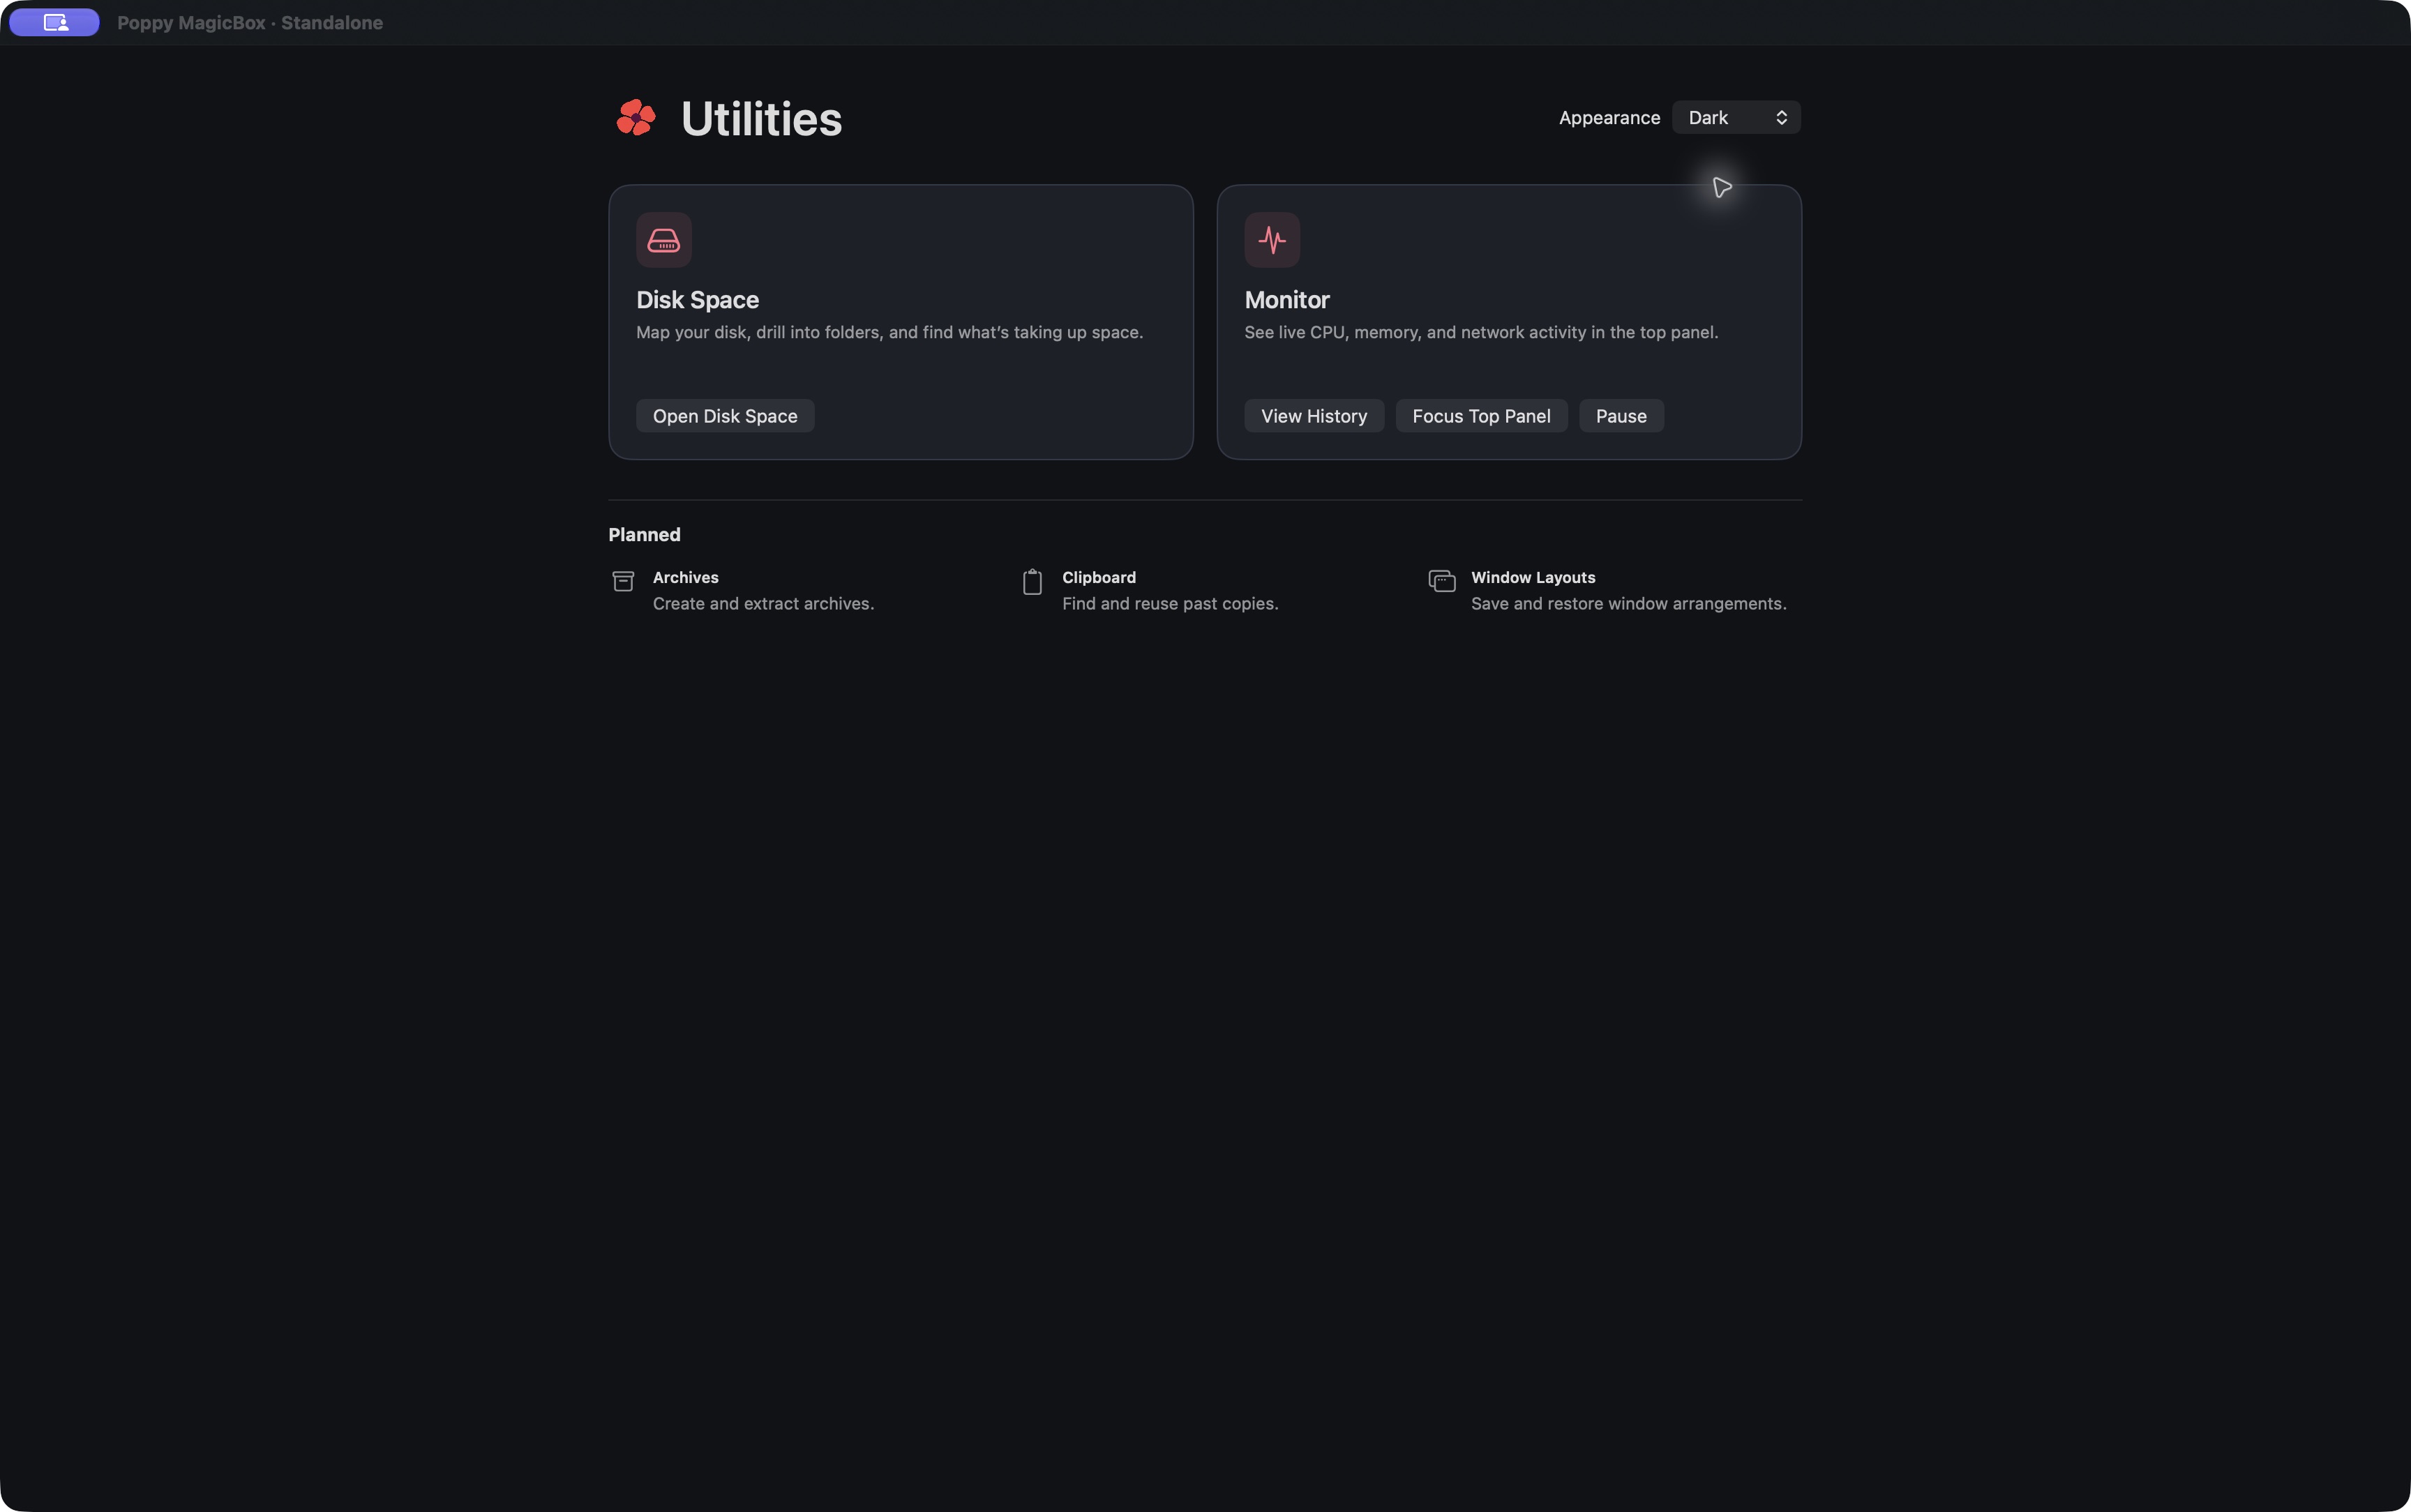
Keep live CPU, memory, network and storage readings in a slim panel at the top of your screen. Open a reading for a closer look, or use Disk Space to see what’s taking up room.
Pin the top panel to keep it visible as you work. Select a metric to see the detail card it opens. The images below were captured in the standalone app.
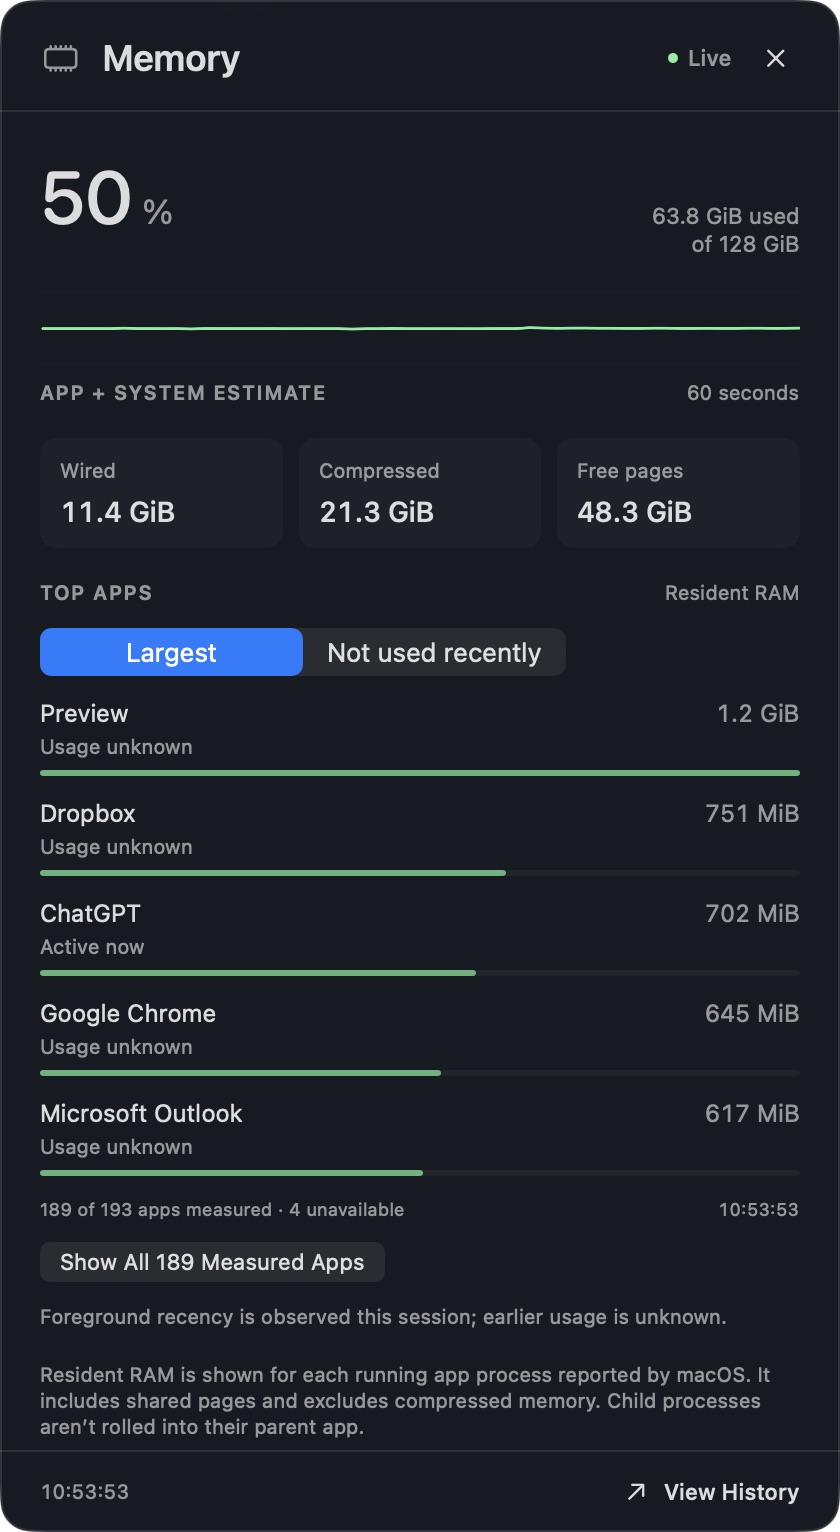
Memory
See estimated memory use over the last minute, with separate readings for wired memory, compressed memory and free pages. The standalone app also ranks running apps by resident RAM and can show which ones haven’t been in the foreground recently.
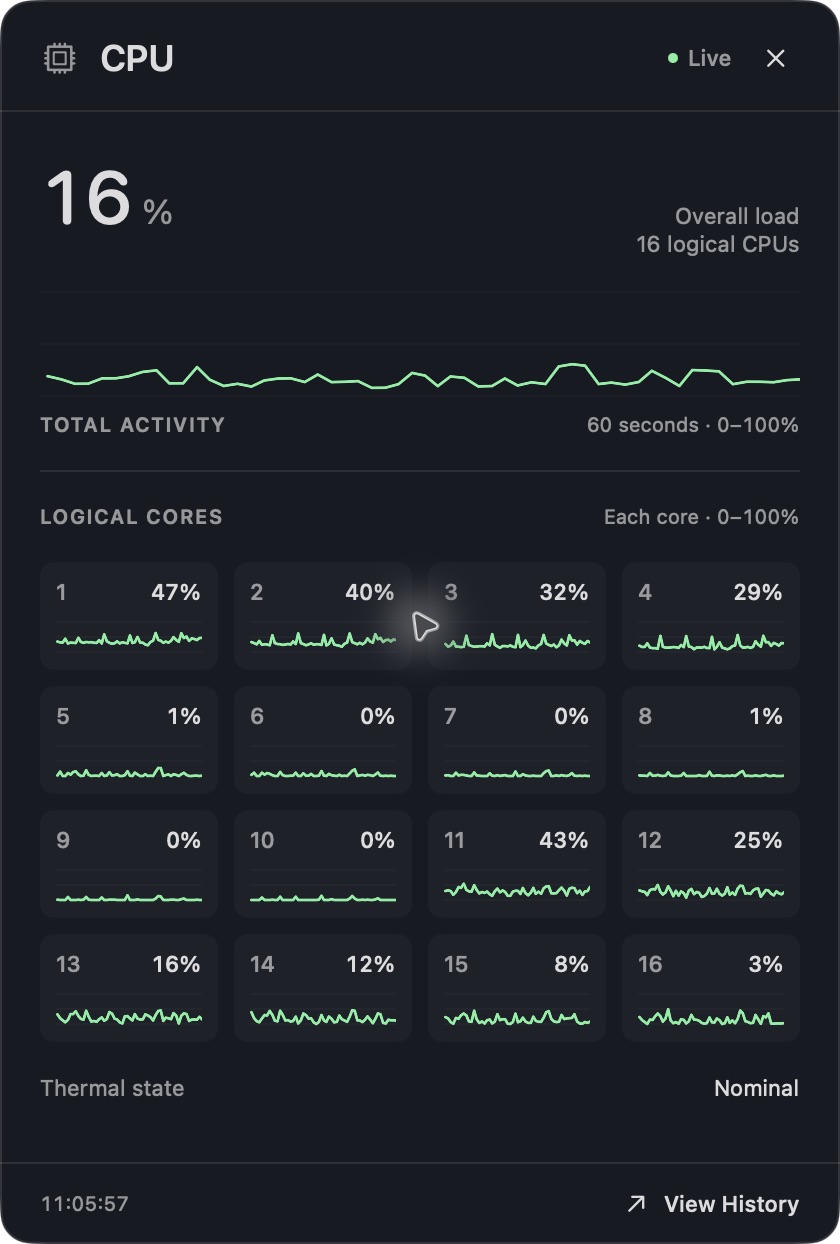
CPU
Track overall CPU load over the last minute and see the activity of each logical core on its own 0–100% scale. The thermal state at the bottom shows the condition reported by macOS.
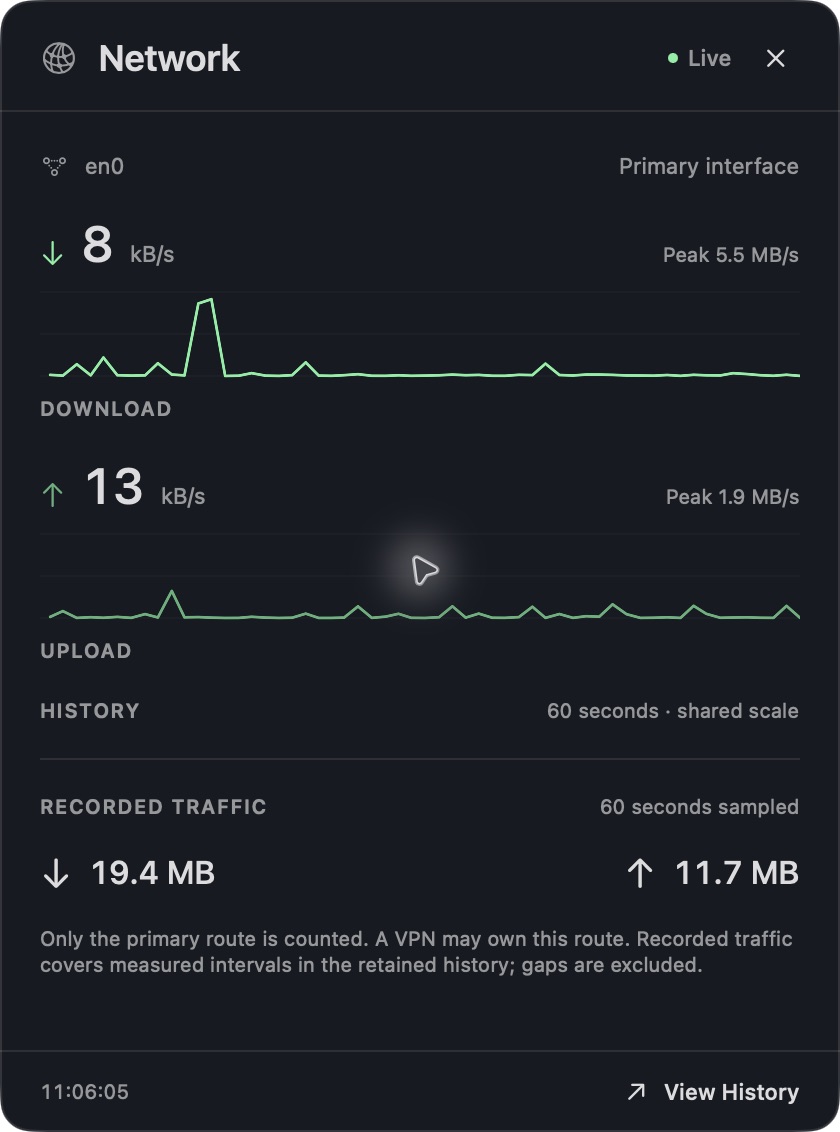
Network
Compare download and upload rates on one chart scale. See recent peaks, how much data was transferred during measured intervals, and which interface is carrying the primary route. A VPN can be that route.
Disk Space
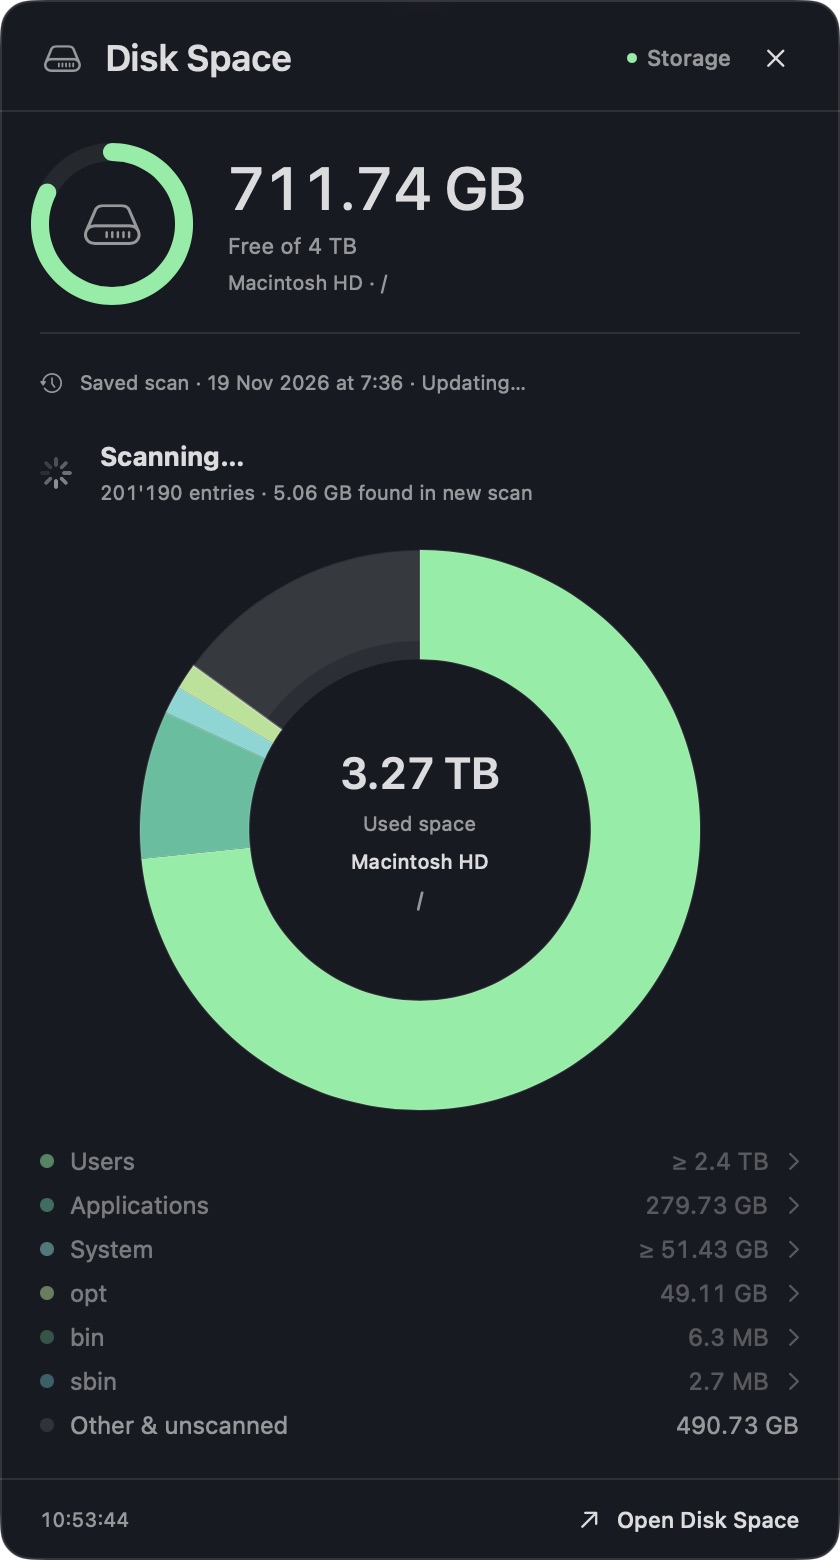
Check free capacity, see the space used by the largest folders, and follow a scan as it runs. Select Open Disk Space to explore the full map and drill into folders.
Panel options
Open the … menu to change the appearance and background transparency, choose a display, turn on the live menu-bar reading, or pause monitoring.
Monitor History
Choose View History from the CPU, memory or network card to see up to an hour of readings saved on your Mac.

 Poppy MagicBox